One of the tasks I completed today was finishing a control dashboard specifically requested by the Nutrition Service at the Hospital. This dashboard is designed to display only the activities performed by nutritionists, such as outpatient consultations, on-call notes, progress notes, and interconsultations. The Head of the Nutrition Service wanted to evaluate her staff not only based on the quantity of consultations or notes made during their shifts but also on the complexity of each type of activity.
During multidisciplinary meetings, a scoring system was agreed upon to assign points to each type of activity performed by the nutritionists. The agreed scoring was as follows:
- First-time consultation note (6 points)
- Interconsultation note (6 points)
- Progress note (4 points)
- On-call note (2 points)
Additionally, it was established that each nutritionist should achieve a total of 3 points per day for on-call notes, progress notes, and interconsultations combined. This requirement varies depending on the nutritionist’s shift. For example, morning shift staff work 5 days a week, while those on an accumulated shift work only 2 days a week.
With this in mind, I designed a new dashboard within the IPM system to incorporate these requirements. First, I slightly modified existing measures, such as first-time consultations and interconsultations, to ensure they only calculate activities related to nutrition.
For example, here is the measure I use to calculate first-time consultations:
Primera Vez = SUMX(FILTER('Consulta externa', 'Consulta externa'[estatus_consulta] = "Primera Vez"), 'Consulta externa'[cantidad])However, to perform the same sum under the context that I only need first-time consultations from the Nutrition department, I need to ensure that the sum is calculated only for records where the ‘especialidad’ field has the value ‘NUTRICION’. Here is the new measure that retrieves all first-time consultations, but only for the Nutrition specialty:
Primera Vez Nutri = SUMX( FILTER( 'Consulta externa', 'Consulta externa'[estatus_consulta] = "Primera Vez" && 'Consulta externa'[especialdiad] = "NUTRICION" ), 'Consulta externa'[cantidad] )This is another example of the same type of measure adaptation I performed, but this time with Interconsultations. Here is the original measure:
TotalInterconsultas = COUNTROWS('Interconsulta')And here is the adapted measure to count only those related to the Nutrition department:
Interconsultas Nutri = COUNTROWS(FILTER('Interconsulta', 'Interconsulta'[serv_inter] = "NUT"))Once that process was completed for all the corresponding measures, I proceeded to create new measures by multiplying the total value of the activities by the score assigned based on the complexity of the activity in question.
For example, for the initial consultations, I simply multiplied the measure adapted for the Nutrition department by the number 6:
primeraVezPunto = [Primera Vez Nutri] * 6I applied this same process to all the measures I adapted to be specific to Nutrition.
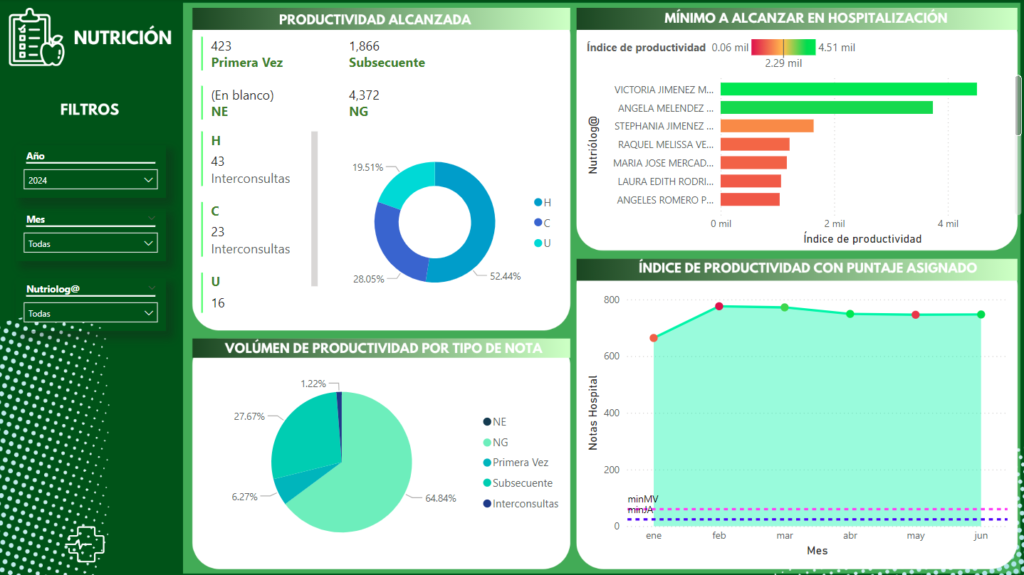
All these steps together allowed me to create a special dashboard for the Nutrition department. This dashboard enables the establishment of a ranking in a horizontal bar chart, where one can see which nutritionist has the highest productivity, considering both the quantity of activities and the complexity of those activities. Here is the final dashboard: