What is the problem to solve?
When I started working in this area, the COINME Excel format was the first thing introduced to me. From the beginning, I noticed it contained dirty data in most of its sections, as well as inconsistencies in the data and some calculation formulas. My mission was to improve this format to make data processing much more efficient and effective. Specifically, there was a need to develop a tool that better consolidated the Hospital’s statistical information. The following are the problems with the COINME that needed to be addressed:
- Discharge Calculation Process: To obtain all the data related to hospital discharges, a «purging process» was conducted, where each record in the discharge list was reviewed one by one. If any record was missing, it was manually added to the main list. This process took approximately 6 hours to complete.
- Confusion Between Reported and Recorded Variables: Every month, the different hospital services sent a report detailing their monthly productivity. However, when entering the data, the concepts in the platform did not match what the services reported, resulting in low data integrity and reliability.
- Lack of Mechanism to Evaluate the Timeliness of Record Submission by Service: Every day, the department received various records managed by the respective service. However, my department was supposed to receive only complete records, which was not always the case.
- Deficiencies in Death Data Entry: The data corresponding to each death certificate were recorded with multiple errors, causing inconsistencies. The same entity was recorded in different ways across various records, generating dirty data problems. These inconsistencies arose due to typographical errors, variations in name spellings, or the inconsistent inclusion of titles and abbreviations. This issue affected the integrity and quality of the database, making accurate analysis and data consolidation difficult.
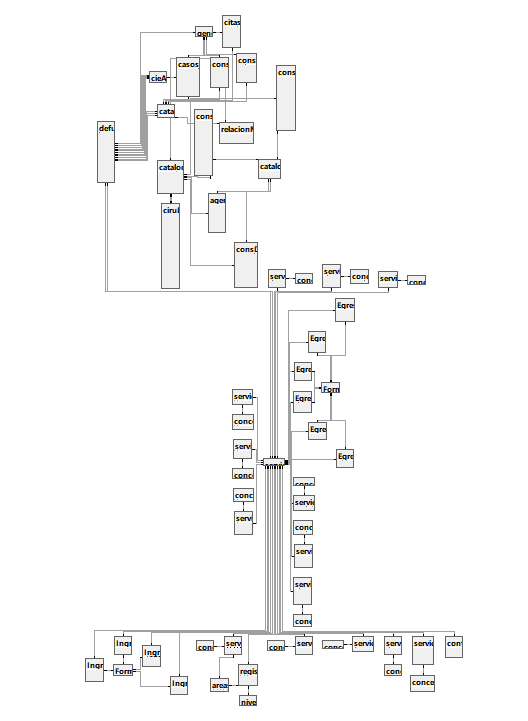
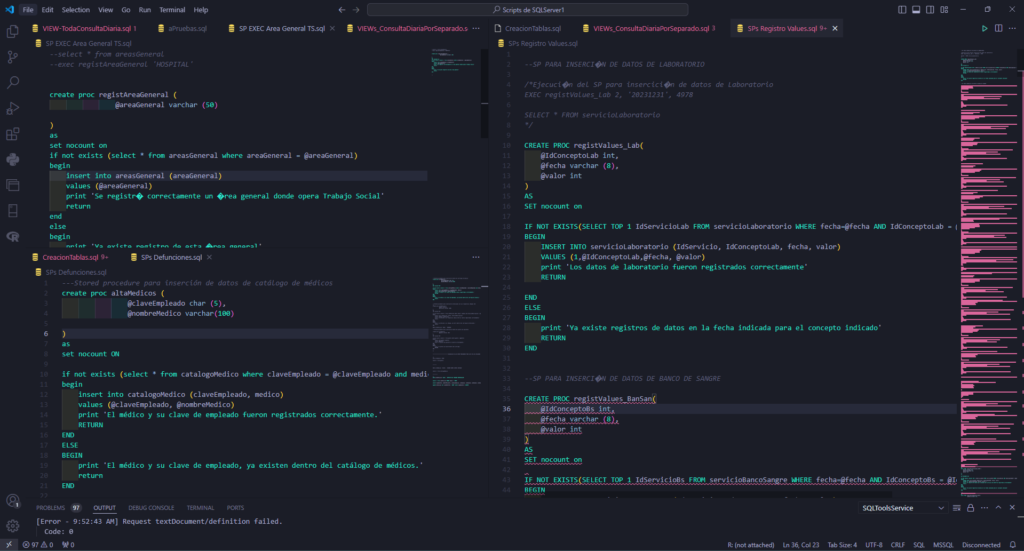
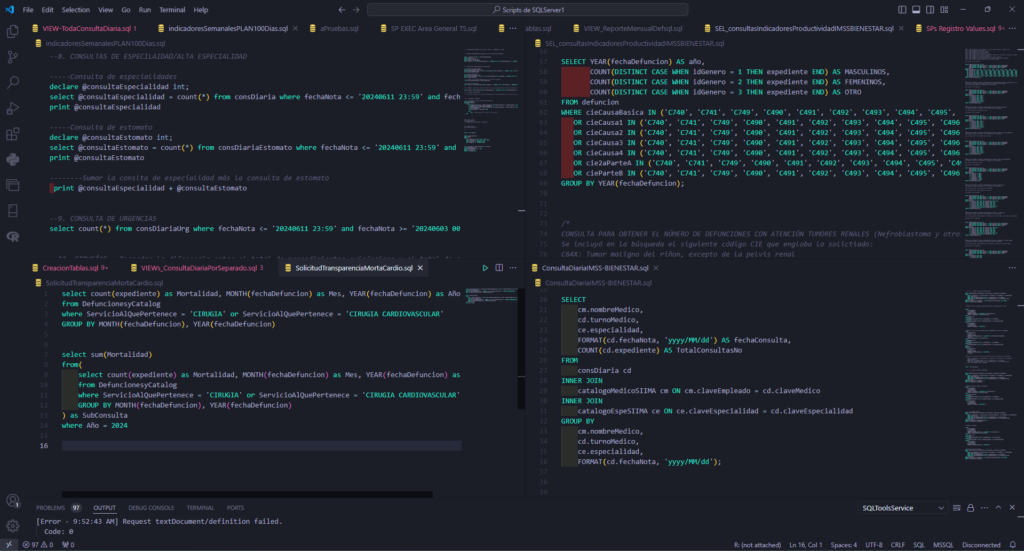
Below, I show images of the different scripts I created for the construction of the tables.
Programming of Stored Procedures for data insertion:
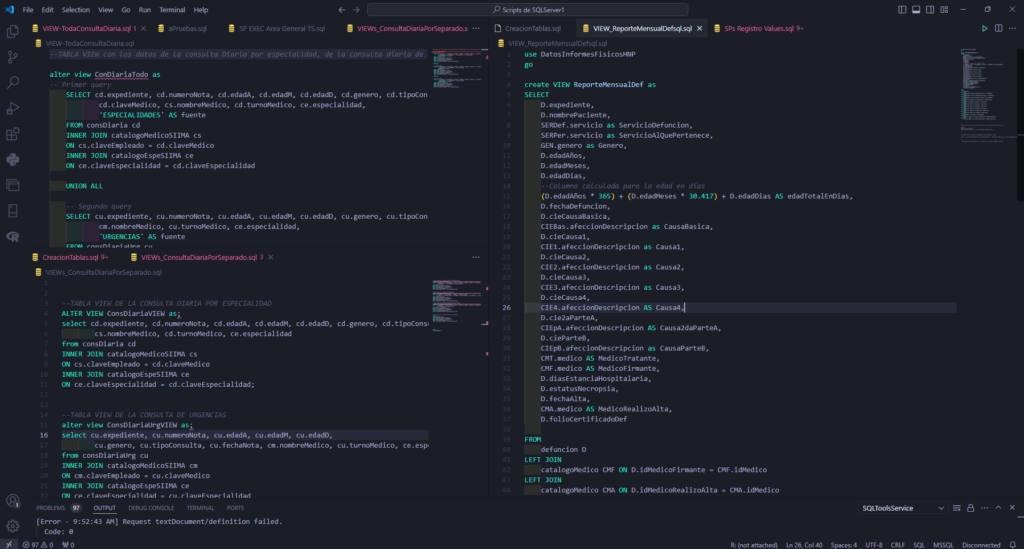
Programming of views to connect to Power BI:
Examples of queries I have made due to complex information requests from federal authorities:
After creating and structuring the database, the next step was to design a dashboard in Power BI. This dashboard automates the analysis and visualization of all the data stored in the database, providing a clear and efficient representation of the information. The result was a robust system that allows for:
- Real-time monitoring: The dashboard offers a real-time view of critical data, facilitating informed and timely decision-making.
- Detailed analysis: Data is presented in a detailed manner, allowing for an in-depth analysis of various relevant metrics and trends.
- Intuitive visualization: Using interactive charts and tables, the dashboard makes complex information easily understandable for all users.
- Report automation: Report generation has been automated, significantly reducing the time and effort needed to produce accurate and up-to-date reports.
- Access to key indicators: The dashboard includes key performance indicators (KPIs) that reflect the status and performance of different areas, helping to quickly identify any issues or areas that require attention.
This integrated and automated approach not only improves the efficiency of data processing but also ensures greater accuracy and reliability in reports and analyses, benefiting all parties involved in strategic decision-making.
What was achieved?
Thanks to the implementation of the database and the dashboards created, several critical issues affecting the efficiency and accuracy in data management in the Statistics Department of the Hospital for the Child of Puebla have been resolved. The following details the corrected errors and achievements obtained:
- Egress calculation process: Previously, obtaining all data regarding hospital discharges required a manual «cleansing process» that took approximately 6 hours. This process involved reviewing record by record and manually adding any missing data. Now, with the automation provided by the database and the dashboard, this process has been significantly simplified and accelerated, eliminating the need for manual review and reducing the time to minutes.
- Confusion in reported variables versus recorded data: Previously, the monthly productivity reports of the different hospital services did not match the concepts recorded on the platform, resulting in unreliable data with low integrity. With the new database and dashboard, the capture of these data has been standardized and automated, ensuring that the reported and recorded information is consistent and reliable.
- Performance evaluation in the delivery of records: Previously, the reception of records was subject to errors since only complete records were supposed to be received, which did not always happen. Now, with the new system, an automated mechanism has been implemented to evaluate and record the performance of record deliveries, ensuring that only complete records are received and processed.
- Deficiencies in the capture of death data: The capture of death data was done with multiple errors, generating inconsistencies due to typographical errors and variations in the way names were written. The new database and dashboard have significantly improved the integrity and quality of these data by automating and standardizing their capture to avoid errors and ensure accuracy in the analysis and consolidation of the information.
Impact on Efficiency:
Additionally, the total time required for the calculation and processing of all information and indicators has been reduced from approximately 3 or 4 days to only 2 hours. This represents an improvement in the department’s performance from 97.23% to 97.92%. This remarkable increase in efficiency not only optimizes the use of time and resources but also allows for quicker decision-making based on accurate data.
Key Achievements:
- Significant reduction in processing time: From days to hours, improving the department’s performance by over 97%.
- Automation and standardization: Data management is now much more consistent and reliable.
- Improvement in data integrity and quality: Data is now more accurate and less prone to errors.
- Efficiency in the management of records and critical data: Faster processes and less manual work.
These achievements reflect the positive impact and substantial improvements realized through the implementation of the new database and dashboard, positioning the Statistics Department at a higher level of efficiency and effectiveness.
Finally, I am providing both the interactive visualization of the resulting dashboard and images of some sections of the dashboard.
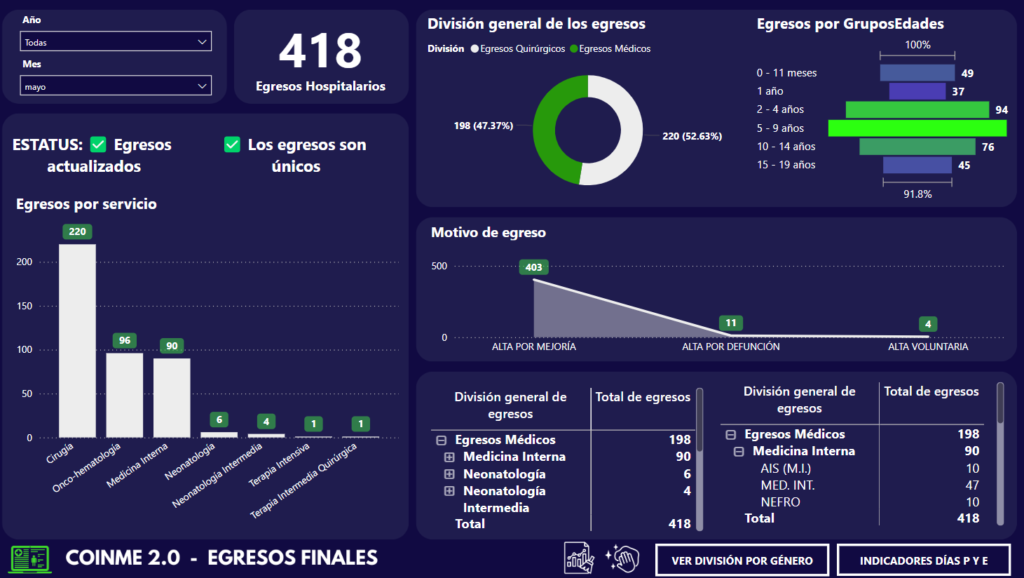
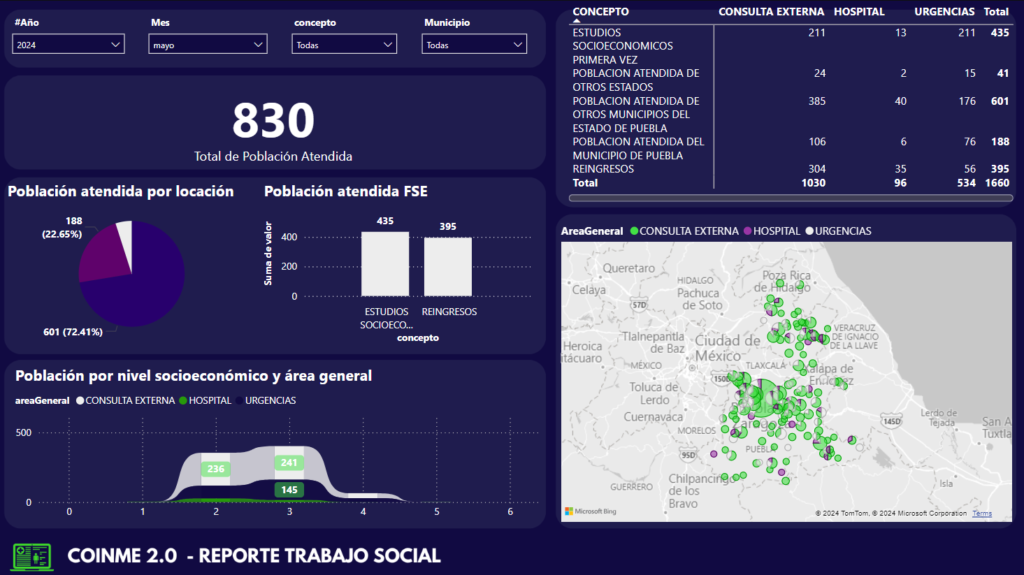
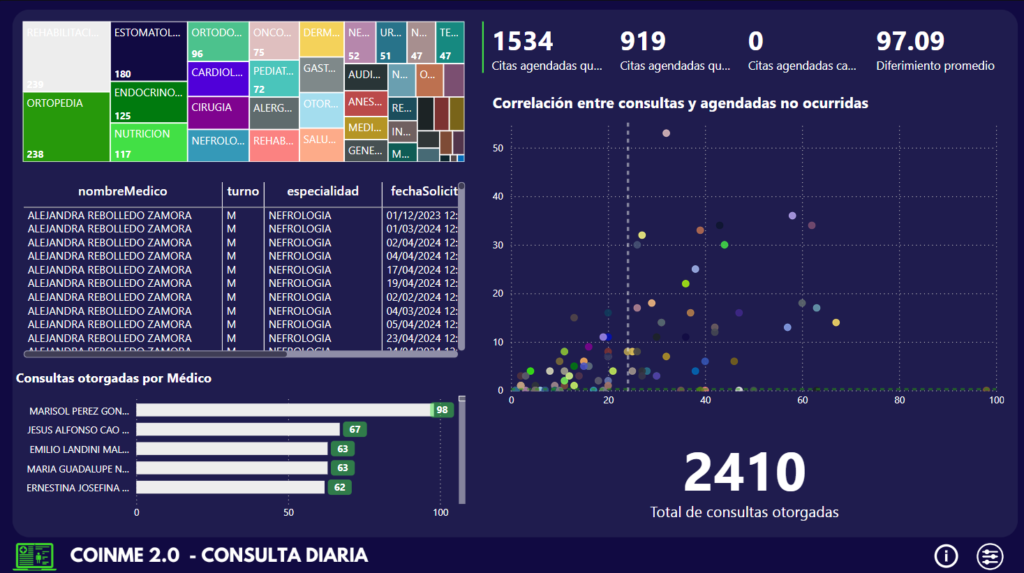
Data Privacy Considerations
Please note that the information and data within the dashboard, as well as the images of the dashboard, have been altered to protect the privacy of the real data from the Hospital para el Niño Poblano. These modifications ensure that sensitive information remains confidential and is not disclosed.