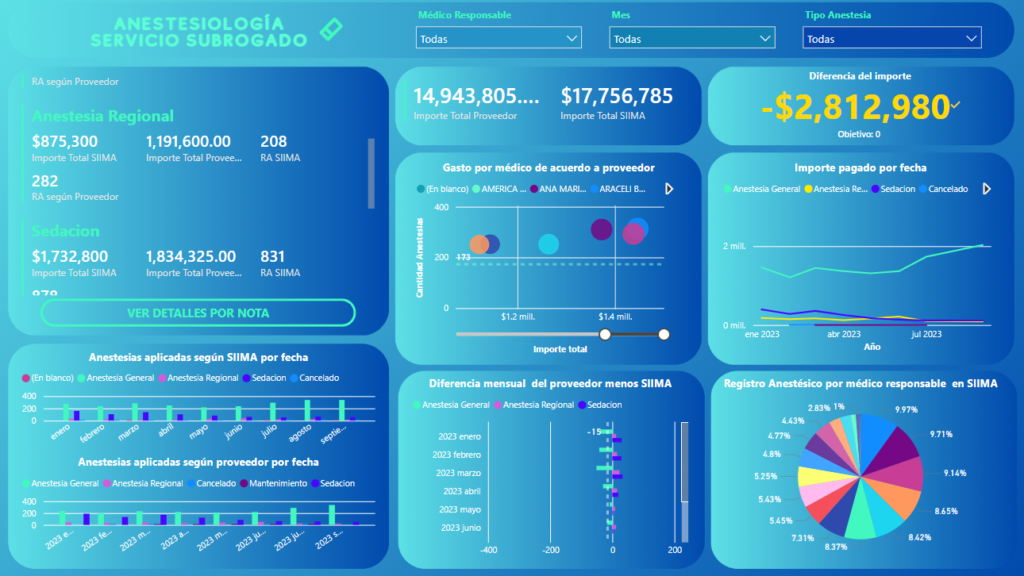
As can be seen, the dashboard automatically calculates (thanks to the data being previously organized and correctly related in the data model) the amount that should be charged according to the hospital’s database records and what the supplier is billing for the applied anesthesia. Additionally, these same data are automatically divided by type of anesthesia, allowing us to accurately identify where the discrepancies lie. To this end, I created an indicator that shows the total amount of money that differs between what is being billed and what should be billed. This indicator works as follows:
- Yellow: Less was paid than should have been paid.
- Red: More was paid than should have been paid.
- Green: This color is used only when the indicator is zero, indicating no difference.
NOTE: In the dashboard image, the indicator appears yellow, but it is important to note that I have altered the real data for the hospital’s privacy. This is simply to demonstrate the functionality of my work.
Additionally, if you want to see the detailed discrepancies in anesthesia billing, you can click on the button labeled «VIEW DETAILS BY NOTE,» which takes you to the next page of the dashboard.
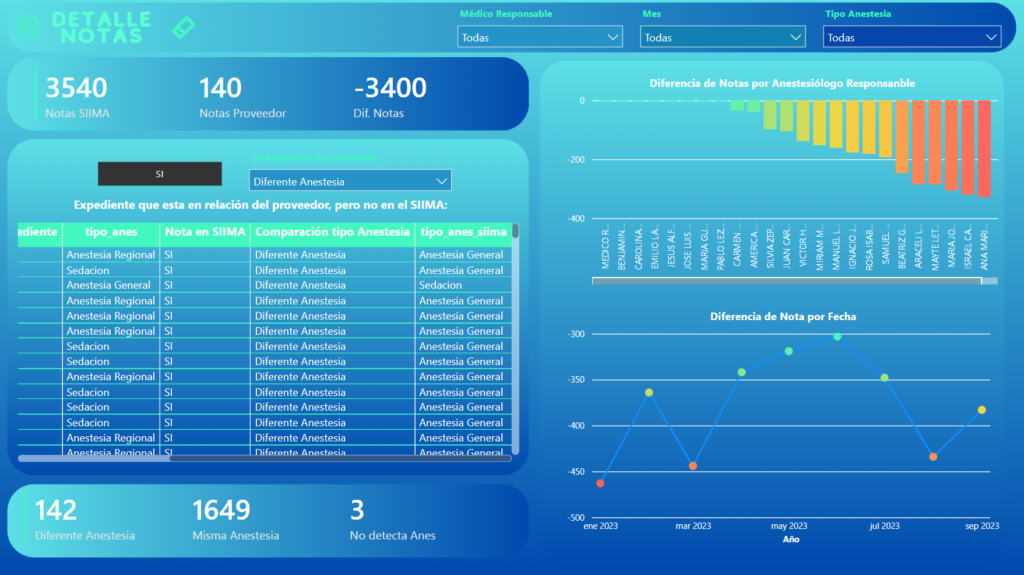
On this page, you can see the hospital notes where there are discrepancies in the applied anesthesia. This is presented both in data table form and through visualizations, enabling timely correction of errors and monthly monitoring of differences.
What was achieved?
The implementation of this dashboard achieved significant improvements in both efficiency and effectiveness within the hospital’s operations. By automating the comparison between the anesthesia used and what was billed by the supplier, the dashboard streamlined the process, reducing the time and effort required for manual checks and calculations.
Impact on Efficiency:
- Automated Data Comparison: The dashboard automatically compared hospital records with supplier invoices, eliminating the need for manual data entry and verification.
- Time Savings: The time spent on cross-referencing data was drastically reduced, allowing staff to focus on more critical tasks.
- Real-time Insights: The dashboard provided real-time insights into discrepancies, enabling quick identification and resolution of issues.
Impact on Effectiveness:
- Accurate Billing: Ensured accurate billing by highlighting discrepancies between what was used and what was charged, preventing overpayments and underpayments.
- Enhanced Transparency: Increased transparency in the billing process, making it easier to justify charges during audits.
- Error Reduction: Reduced the likelihood of human error in data handling and analysis, leading to more reliable records.
- Informed Decision-Making: The clear visualizations and detailed breakdowns of data allowed for informed decision-making and proactive management of anesthesia resources.
Overall, the implementation of this dashboard not only improved operational efficiency but also enhanced the accuracy and reliability of financial transactions related to anesthesia, contributing to better resource management and financial integrity within the hospital.