At the beginning of my career as a data analyst, my work was primarily applied in the political-electoral sector. The project I am about to present is one of those I conducted in this field.
What was the problem to solve?
The problem was to obtain an automatic and reliable analysis of how well the media outlets conducting political propaganda were performing, and to contrast this with the economic stimulus these media outlets were receiving, all in compliance with the electoral laws governing my country and state. It is important to note that the data shown in this project were previously altered for privacy reasons.
Additionally, the stakeholders had a particular interest in creating a dynamic map that displayed the coverage of each media outlet at the municipal level. Based on this information and automatic analysis, strategic decisions could be made regarding which municipalities required more concentrated electoral campaign efforts.
Summary of problems to solve:
- Obtain an automatic and reliable analysis of the performance of media outlets in political propaganda.
- Contrast the performance of the media with the economic stimulus received.
- Ensure compliance with electoral laws.
- Create a dynamic map of media coverage at the municipal level.
- Facilitate strategic decision-making to concentrate campaign efforts in the most needed municipalities.
What did I implement to meet the stakeholders’ needs?
The campaign team stored all their data in Excel; however, the format and organization were not suitable for use in Power BI. To address this, I subjected the data to a rigorous cleaning and proper organization process. Additionally, as with all my projects, I performed table normalization to relate them within the data modeling.
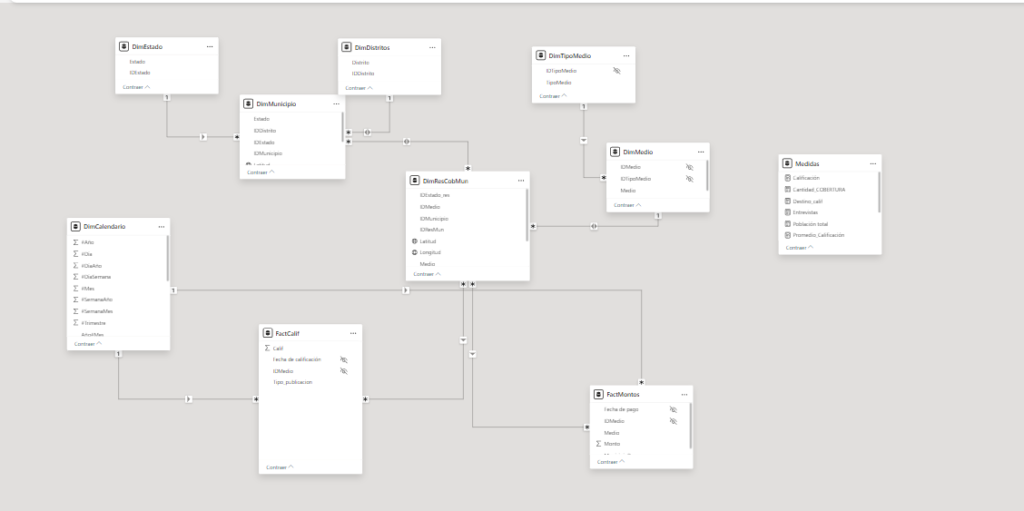
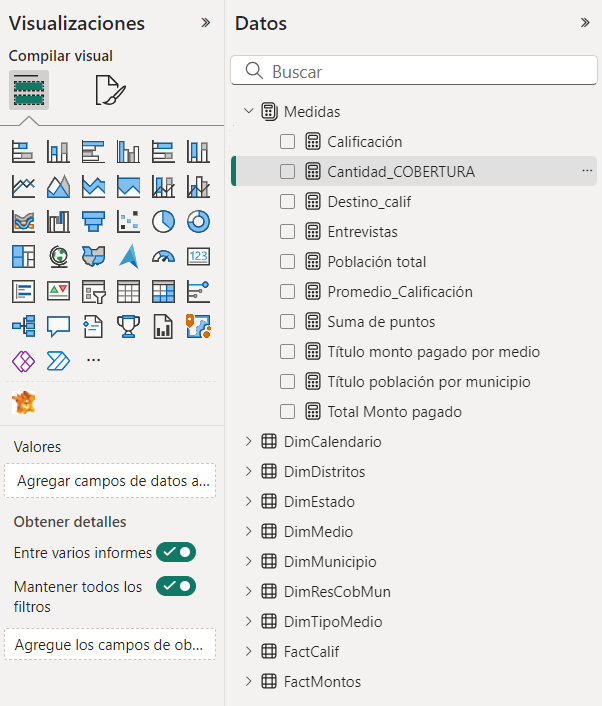
Once this process was completed, I proceeded to model and design the entity-relationship diagram within Power BI, as well as design some DAX measures to optimize the analysis.
Ultimately, this resulted in the following dashboard, which not only met all the stakeholders’ requirements but also provided additional functionalities.
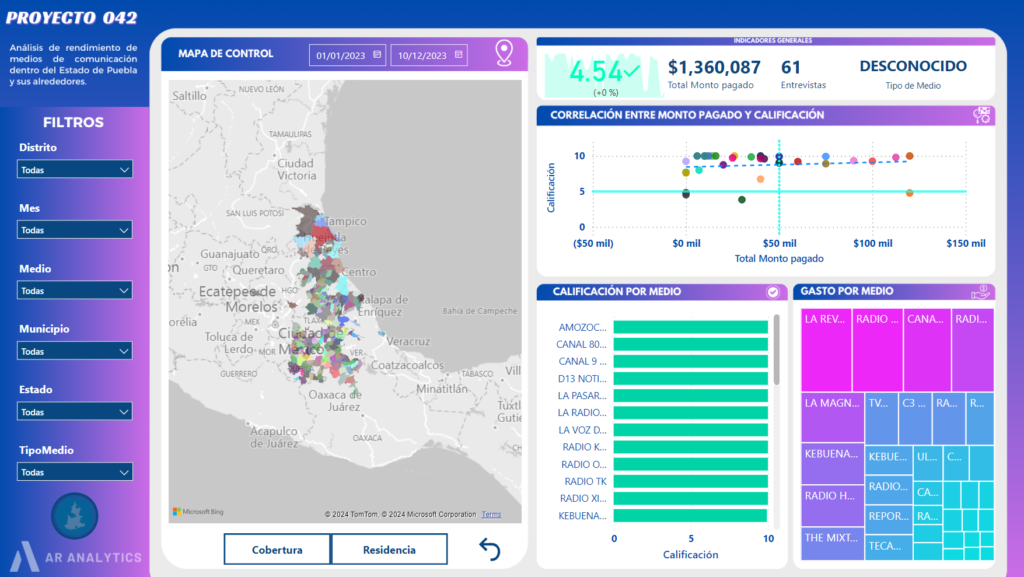
The dashboard features a chart that shows the correlation between the money invested in each media outlet and the rating assigned based on its performance. In this chart, each colored point represents a media outlet. Media outlets located in the upper right quadrant of the chart indicate that they are receiving high compensation and have an excellent performance rating. Conversely, those in the lower right quadrant are receiving significant funds in exchange for poor performance and compliance.
Results Achieved Through the Implementation of the Media Performance Analysis Tool in Electoral Matters:
The implementation of this performance analysis tool has significantly transformed how political campaigns are managed and evaluated. Through the created dashboard, the following key results have been achieved:
- Accurate Performance Evaluation: The tool provides detailed and automatic analysis of the performance of media outlets involved in political propaganda. This has allowed for precise identification of which media are effectively meeting their objectives and which are not.
- Optimized Media Spending: By correlating the money invested with performance ratings, resources have been allocated more efficiently. Funds can now be directed to media outlets showing high performance, reducing expenditure on those with poor results.
- Transparency in Resource Allocation: Detailed analysis and clear data visualization have increased transparency in resource allocation. This facilitates expenditure justification to auditors and stakeholders, ensuring compliance with electoral regulations.
- Strategic Decision-Making: The tool has enhanced stakeholders’ ability to make informed decisions about where to concentrate campaign efforts. The dynamic map and performance analysis enable strategic adjustments based on media coverage and effectiveness.
- Identification of Inefficiencies: The dashboard has facilitated the identification of media outlets that receive high payments without delivering corresponding performance, allowing for the correction of inefficiencies and optimization of media investment returns.
- Continuous Improvement: The tool allows for real-time monitoring of media performance, facilitating ongoing adjustments and improvements in electoral campaigns.
In summary, the implementation of this analysis tool has enabled more effective and efficient management of resources allocated to political propaganda, ensuring that media investments align with the objectives and expected outcomes of electoral campaigns.